
The real estate market in Park City and the Wasatch Back continues its trend toward more conventional market dynamics. After the volatility we experienced over the past few years, the frenzied activity and meteoric price rises have been replaced with activity that is trending toward historical norms. While some numbers are down year-over-year, they nonetheless represent more of a return to normal for our market.
During the second quarter of 2023, the number of homes sold in the greater Park City area was down, dropping 33% for single-family homes and 43% for condominiums from the year prior. While property sales were dwindling, inventory showed signs of recovery. Residential listings rose to 1,030, up from 858 the year prior, inching closer to the historic pre-pandemic average of approximately 1,100 active listings for the same quarter.
Price gains are leveling off. Compared to the large, across-the-board gains that we experienced during the last few years, price changes during the second quarter of 2023 were for the most part comparatively small. However, pricing varied quite a bit across property types and neighborhoods, demonstrating the segmentation of our market. In general, buyers are now more hesitant to make instant offers. Sellers are also more inclined to drop the price of their properties after a period of low interest and are more willing to accept offers under the asking price.
Lastly, demand seems to be slowing compared to the red-hot market of the last couple of years. Pended sales this last quarter were down 30% from the same period in 2022 but down only slightly from 2020, indicating a trend toward more “normal” sales rates.
What’s driving these changes? The primary culprits seem to be persistently high mortgage interest rates and the scarcity of inventory. Many real estate agents point out that a significant portion of homeowners who are still servicing their mortgages secured their loans at rates substantially lower than the current market rates. This disparity deters them from selling, especially if they need to finance a new home.
Source: PCBOR Q2 2023 Quarterly Market Summary, 12-month rolling year over year for all property types across the PCMLS service areas in Summit and Wasatch Counties.
Park City Real Estate Market Overview


Park City Real Estate Inventory on the Rise
Inventory has improved significantly but remains a third less than pre-pandemic levels, primarily because of the high interest rates. Many owners with an older mortgage at 3% or less can’t sell unless they can pay cash for a replacement home.
Across all property types, as of July 1st, 2023, there were 894 total listings, compared to 769 on the same date in 2022, representing a modest 16% gain.
When sorted by property type, condominium inventory is down 4.5%, single-family inventory is up 23.1%, and vacant land inventory is up 35.9%.
Since the start of 2022, inventory has improved dramatically but has remained relatively flat for the past year. However, this recent plateau is still lower than the previous flat period that spanned from 1/2013 – 3/2020. Since this period from 2013 to 2020 represents a reasonable benchmark for a stable market, our inventory still has room to grow before we back to “normal” inventory levels.


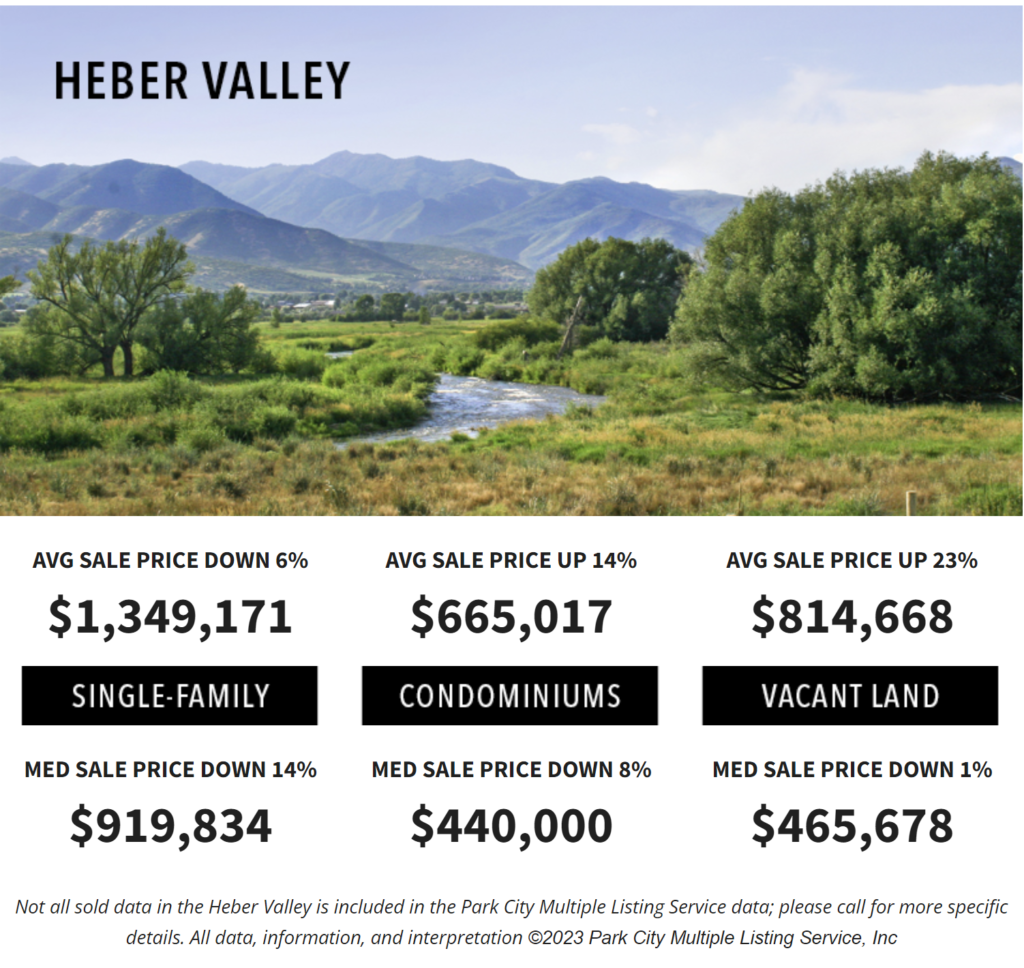
Park City Neighborhood Highlights
The statistics below were drawn on a rolling year-over-year basis for the period ending June 30, 2023, unless otherwise noted.
Despite fluctuations in the regional markets, single-family home sales activity in the primary market area was markedly down compared to the year prior, with sales volume 35% less, while prices were steady but mixed.
For single-family homes, all but two of the major areas that make up the greater Park City market showed drops in units sold through the 2nd quarter of 2023 versus 2022. The exceptions were in the Jordanelle area, where interest is growing in anticipation of the Mayflower Mountain Resort opening set for the 2024-25 ski season. Sales in the Tuhaye area has more than doubled over the previous year, with average prices just over $3 million. The other boom happened in Silver Creek South, where the Silver Creek Village continued to be a hive of activity. Sales nearly quadrupled, from 12 to 47, on pricing that climbed from the high six figures to about $1.1 million.
HIGHLIGHTS | Stats by Neighborhood
The number of sales across the primary market area dropped 33% year-over-year but increased 22% quarter-over-quarter. The short-term gain likely indicates a trend of increasing sales that should show in the year-over-year totals in the coming quarters. A 2% to 4% decline in the median sales price to $1.5M contributed to the 35% drop in total sales volume. Through Q2-23, the $1.85B in total year-over-year sales volume was down from the Q2-22 year-over-year total of $2.86B.
Within Park City limits, total unit sales were down 44% to 90 units. Sales volume for Park City homes declined 45% to $389 million this year. The median price of a single-family home within Park City limits fell 8% to $3.4 million. In the popular Old Town area, unit sales were barely more than half of the previous year (42 to 24) as the median price climbed 20% to $3.77 million. Snyderville Basin residences followed the prevailing market with sales volume (down 39%) on a modest gain in the overall median price, up 3% to $2.05 million. All but one Snyderville neighborhood (Silver Creek South) saw declines in units sold, with Jeremy Ranch dropping the most (55%) to just 17 units. Silver Creek South had the only gain with 47 homes sold, nearly four times as many as in the previous year, thanks to their price point as well as a large number of new construction units happening in Silver Creek Village. One-third of overall sales volume in the Basin was in Promontory ($264 million). Silver Creek South also had the biggest price increase with the median rising 29% to $1.1 million. Canyons Village held on to the top position with a median price of over $9 million. Among the outlying areas, the Jordanelle area showed the greatest median price increase of 13%.Pa
PARK CITY CONDOS & TOWNHOMES

Park City Condo sales volume across the primary market area followed a pattern similar to single-family homes. Total sales volume declined in all areas by 36%, primarily due to a lack of inventory. Within the Park City limits, condo sales volume was down 24%, but the median sale price rose 24% to $1.7 million. In the Snyderville Basin, the average sale price only rose by 2% to $1.2 million.
HIGHLIGHTS | Stats by Neighborhood
The Condo market in Old Town paralleled the single-family numbers, with unit sales and volume down, despite a gain in the median price of 36%. The median price of a condominium sold in Old Town is now $1.35 million. Price gains were evident in all neighborhoods, with Upper Deer Valley leading the gainers with a 151% median price increase to more than $4.5 million. In the Snyderville area, outside of perennial volume leader Canyons Village, Pinebrook and Kimball Junction led in sales volume ($33M and $34M respectively). In Wasatch County (areas where 10 or more sales are reported), Jordanelle Park showed the largest gains in sales volume over the prior year (up 48%) despite a decline in median price, down 17% to $805,000.
PARK CITY VACANT LAND
After the explosive growth we saw in 2020 (up 158% in sales volume) and 2021 (up 73%), land sales slowed this past year, with overall volume dropping 57% in the primary market area. Every major area showed drops in units sold. Total sales volume dropped in all areas except Wanship/Hoytsville, where sales volume was up 68% on prices that nearly tripled from the year prior. The bulk of these sales were in the new Wohali development near Coalville, which featured multi-acre lots selling for more than $1 million each.
HIGHLIGHTS | Stats by Neighborhood
Jordanelle showed the most activity, selling 274 lots this past year. The median sale price was $700,000, up slightly from the year before. Overall, land sales in Summit and Wasatch counties were down 48%, as supply decreased. But prices remained unchanged, having settled at a median of $650,000. All the major areas of the market saw a drop in units sold. Snyderville and Heber Valley were hit the hardest, dropping by more than half from the previous year’s total. Only 15 lots sold within the Park City limits, but the lack of available lots, coupled with high demand, kept the median sale price at just below $2 million.
The real estate market here in Park City and the Wasatch Back has entered a cool down compared to the superheated market of the past few years. We are slowly transitioning from the pandemic’s frenzy to a period of more consistent, measured growth.
It is always important to keep in mind that our market is highly segmented, and at any given time, some neighborhoods and property types can experience high demand while others remain flat. Overall many of our key metrics are still near historic averages despite being down from the robust numbers of the past few years. For instance, while our recent sales might not match the fervor of 2021 and 2022, they’re holding steady compared to the average rates from 2013 to 2019.
Moving forward, economic concerns paired with climbing mortgage rates are likely to continue to act as headwinds for the overall market. Thankfully, our market tends to perform very well during the summer, and we are optimistic this year won’t be an exception. Additionally, there is a silver lining for those worried about today’s high mortgage rates – they won’t last forever, and refinancing is always an option down the line.
To sum it up, the Park City real estate market might be adjusting its pace, but it remains a solid choice for long-term investments. As always, please don’t hesitate to reach out with any questions or for personalized insights.


